|
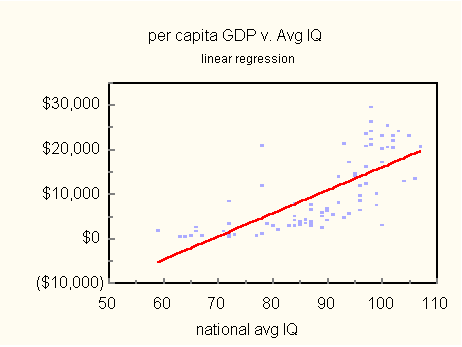
Mentor. Welcome Prodigy, very glad to see you. Prodigy. Thank you Mentor. I want you to meet my friend, Estraneo al Mondo. He is visiting from the Sorbonne. Mentor. Welcome Estraneo. Prodigy. I was hoping that we could continue our discussion of human biodiversity. I brought some fascinating data from the Summer 2001 Mankind Quarterly. In the article, National IQ and Economic Development: A study of Eighty-One Developing Nations, Richard Lynn and Tatu Vanhanen expose a relationship between national wealth and IQ. I brought a table of their data, but you can see the relationship best in a graph (Figure 1).
Figure 1. Per capita GDP vs. national average IQ. The regression line is shown in red. The correlation coefficient is 0.73. Notice how GDP is positively correlated to average IQ. The correlation coefficient is 0.733, IQ explaining 54 percent of the GDP variance. Values this large are rare in social science. Forgive me if I seem patronizing, Estraneo, but a correlation coefficient (correlation for short) is a quantity that reflects the strength of association between two variables. Its values range from -1 to 1. If variables are independent of one another, their correlation is zero. If they are perfectly correlated their correlation is 1 or -1. Positive coefficients mean that one variable gets larger when the other gets larger, and negative correlation the opposite. The fraction of the variance explained by the independent variable is simply the square of the correlation coefficient. The regression line is the line that best fits the data. Estraneo. Not much of a fit as I see it. Prodigy. That's because the relationship between per capita GDP and mean IQ is not linear. The fit is the best that can be obtained with a line. Estraneo. Is nonlinearity important? Prodigy. Correlation indicates the degree of linear association between variables. Because, the relationship is nonlinear, the value 0.73 actually underestimates the strength of the relationship. Mentor. I notice several conspicuous outlying points. What is that about? Prodigy. Some of this is experimental error, but a few outliers are due to cause. South Africa, for example, is the world's largest producer of platinum, gold, chromium and diamonds. None of this has much to do with human resources. Barbados and Qatar have also been favored with wealth-producing assets. Barbadian economy is based mostly on tourism. Exceptional year-round climate combined with proximity to the US strengthens its economic base irrespective of IQ. Similarly, oil revenue accounts for Qatar's extraordinary GDP. Finally, with a market economy being necessary for prosperity, we find Communist China, with a mean IQ of 100, producing more like a country with a mean of 83. Mentor. What happens to the correlation when the four outliers are removed? Prodigy. It grows a bit to 0.79, so that 62 percent of the remaining GDP variance is now explained by IQ. Mentor. The relationship between IQ and individual achievement is well known. No where is it better documented than in Herrnstein and Murray's The Bell Curve (Free Press, 1994). Lynn and Vanhanen have scaled this connection up to a national level. It looks like they have added a new dimension to the meaning of IQ. Prodigy. I do have a few
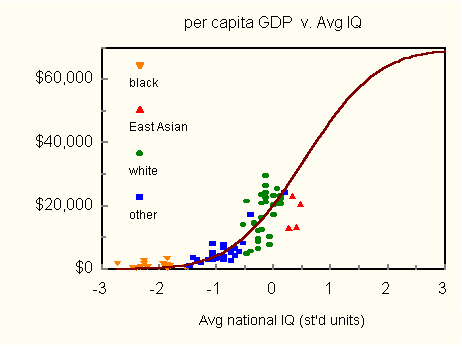
modest observations. In Figure 2, the data is divided into contributions
from four groups: blacks, (European) whites, East Asians and "others." I did not include the outliers: South Africa,
Barbados, Qatar and China.
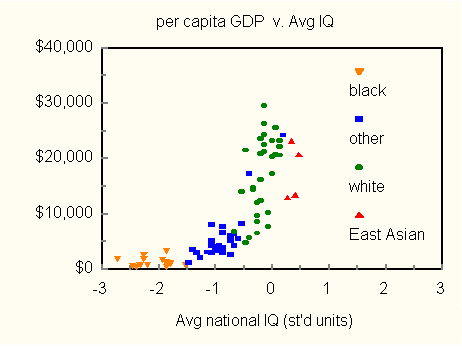
Estraneo. Amazing! IQs cluster by race. Prodigy. I would like to take credit for this discovery, but unfortunately it has been known for many years. The only debate among scholars now concerns how much of IQ is heritable. Estraneo. What race are "others?" Prodigy. Various. Indians, Latin Americans, Pacific Islanders, Middle Easterners, other Asians, etc. Many of these countries have racially or ethnically heterogeneous populations. Estraneo. Why have you switched IQ units in Figure 2? Prodigy. Standard units are convenient. Each observation is expressed in terms of the number of standard deviations from the mean. With a mean IQ of 100, and a standard deviation of 15, for example, IQs of 85, 100, 115 and 130 become in standard units: -1, 0, 1 and 2, respectively, etc. Estraneo. One other point. Am I wrong or are the four East Asian points displaced from the trend line? Prodigy. You are correct.
The four, Taiwan, Japan, South Korea and Hong Kong, all with homogeneous populations,
have the highest IQs reported here. We might therefore expect them to be among the wealthiest of nations. Their numbers,
especially those of Taiwan and South Korea, however, tell another story.
With average IQs of 104 and 106, respectively, per capita GDPs of about $13,000 seem much too low for Taiwan and South Korea. Estraneo. Hold on. There are a number of other nations whose GDP is much lower than expected. Why single out these four? Prodigy. Because they form a distinct cluster of racially similar peoples. Each has a mostly homogeneous population. Though small, the group stands apart as a unit. We cannot draw firm conclusions based on four points. The observations do, however, raise questions about East Asian achievement. IQ alone does not determine wealth. Perhaps East Asians are wanting in other attributes. Or, maybe there are aspects of Eastern culture that undercut creativity. These questions need to be investigated. The East Asian anomaly might well be an artifact, but for now the issue remains unresolved. Mentor. There is another interesting feature on your graph, Prodigy. Per capita GDP in black countries seems nearly independent of IQ. Prodigy. I noticed that too, Mentor, and computed a correlation coefficient for the 15 black nations as a group. The result, 0.034, confirms your observation. It seems there is an IQ threshold to be reached before a country can get off the ground economically. None of the black nations has yet reached this threshold. Here are the black-nation data.
Mentor. Estraneo referred to a "trend line." The points in Figure 2 do look as if they could be described by a smooth curve. Could a model be lurking in the background? Prodigy. I have tried, without luck, to come up with a model that accounts for the data. Mentor. Let's think a bit. As civilization becomes more complex, the demand for cognitive ability increases. Perhaps you can take this simple proposition, and from it fashion a model to explain the data of Lynn and Vanhanen. Prodigy. Interesting idea. Suppose, in order to contribute significantly to a nation's productivity, a sophisticated economy demands of its work force some minimum cognitive ability, say IQ0. We might call the population fraction with IQ > IQ0 a nation's smart fraction. A model can be constructed based on the simple assumption that per capita GDP depends on the size of the smart fraction. In the simplest case, per capita GDP would be proportional to the smart fraction. That is, writing G for per capita GDP, and f for smart fraction, such a model would assert that:
Mentor. Will such a model fit the data of Lynn and Vanhanen? Prodigy. Maybe. We can easily reveal its essential properties. For a given population, it is safe to assume that lots of people will have IQs near the population mean, and not too many will have IQs much more than one or two standard deviations away from the mean. Mentor. Are you implying a bell-shaped IQ distribution? Prodigy. No, the qualitative features of the model can be fleshed out simply by assuming that IQ distributions peak up near their means, and fall off on either side. May I borrow a pencil, Mentor? Mentor. Take several. Prodigy. Let me sketch a typical IQ distribution. The smart fraction is represented by the area under the curve beyond IQ0. I've drawn a distribution for a low-IQ population with a rather small smart fraction. 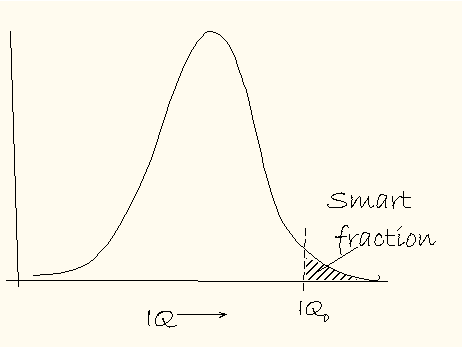 More clever populations will have bigger smart fractions. As we progress to smarter nations, however, constant
increments in mean IQ will not produce constant increments in the smart fraction. At first, the smart fraction will increase
quickly, accelerating until the IQ distribution peak passes IQ0. Thereafter, further increments in IQ will produce ever
smaller smart fraction gains. Here, let me sketch it. 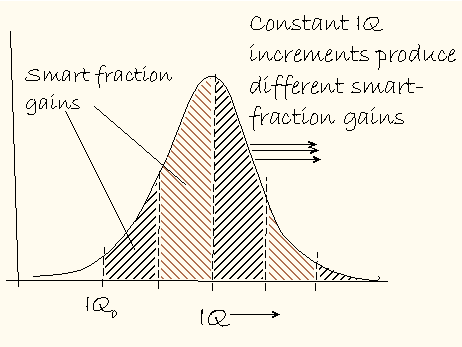 The resulting dependence of smart fraction on mean IQ is s-shaped. The same goes for per capita GDP because it has been assumed proportional to the smart fraction. Thus, according to this model, per capita GDP vs. mean IQ will look like this: 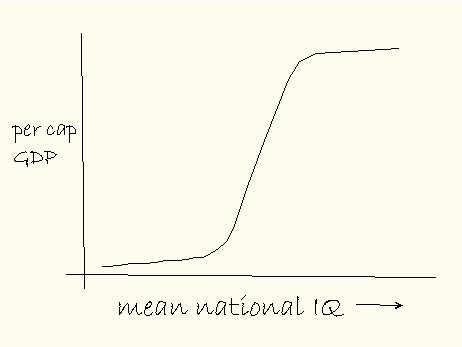 The assumption that national wealth is determined by the fraction of workers with IQ equal to or greater than some minimum value implies that per capita GDP depends sigmoidally on mean IQ. We can call this Smart Fraction Theory or SFT for short. Let's see how the model shapes up quantitatively. The smart fraction, f, of a population is given by
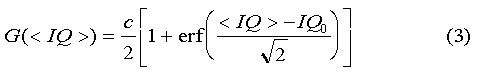
where P is the IQ distribution function for the population. From (1) and (2), using Gaussian functions to do the arithmetic, we find the dependence of per capita GDP on mean IQ, <IQ>, to be:
Thus, for a technologically sophisticated society, SFT asserts that a nation's per capita GDP is determined by the population fraction with IQ greater than or equal to some threshold IQ. Consistent with the data of Lynn and Vanhanen, that threshold IQ is 108, a bit less than the minimum required for what used to be a bachelor's degree. Figure 3 illustrates the fit of (3) to the data of Lynn and Vanhanen.
Prodigy. The problem is one of time. According to SFT, per capita GDP approaches an asymptote, which we estimate from the data of Lynn and Vanhanen to be in the neighborhood of $70,000. Presently, even the best economies are no where near this. We need data from nations with mean IQs near 130. Estraneo. I suppose then that SFT will never have a complete test. Prodigy. Perhaps, but not necessarily. World IQs have been increasing at the rate of 3 IQ points per decade (the Flynn effect). If that trend continues, countries now in the mean-IQ neighborhood of 100, will near smart fraction saturation in about a century. Estraneo. What happens then? Prodigy. Per capita GDPs will level off first for the smartest nations, allowing GDPs of less bright nations to catch up. Should the Flynn effect prove real, in time the nation's of the world will all look pretty much alike from an economic perspective. Estraneo. That is my dream. Prodigy. Eugenic practice could accelerate the process markedly. Estraneo. Quelle prétention! Quelle hypocrisie! Mentor. I fear our discussion is about to warm up, so let me return to the troublesome underperformance of East Asians. Can SFT can shed light on this matter? Prodigy. What have you in mind, Mentor? Mentor. It has been suggested elsewhere that East Asians are less differentiated than other societies. That is, they have narrower distributions of various attributes, including IQ. If this were the case, it would be possible for an East Asian nation simultaneously to have a very high mean IQ and a small smart fraction. Could this account for the modest East Asian GDP? Prodigy. I am familiar with this speculation in a different context. It has been advanced to explain the civilization gap between East and West. Advances in civilization, however, are usually made by extremely bright people, geniuses and (ahem) prodigies. SFT looks not so much at these gifted individuals, but at those with IQs equal to or greater than about 108. SFT is not about folks who win Nobel prizes, but about folks who can get through a maze in decent time. That aside, changing the width of an IQ distribution does alter the smart fraction. Let's see how much. Assuming an IQ edge of 5 points for Asians, I calculate that the standard deviation of the Asian distribution must be 39 % that of the white to obtain equal smart fractions. For this case the relative distributions look like those in Figure 4.
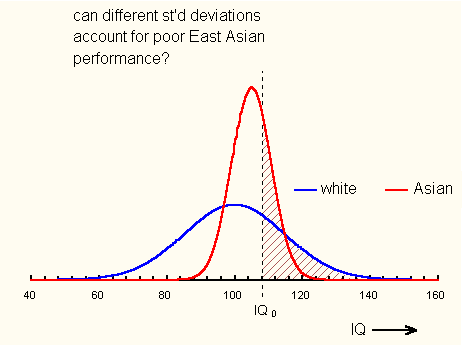
An Asian distribution with a standard deviation 39 % of the white brings the two smart fractions into coincidence. An even narrower distribution would be required to explain the Lynn-Vanhanen data. Either way, there is no evidence to support such a difference in spread. I'm afraid we will have to look elsewhere for an explanation. Mentor. Thank you, Prodigy. Estraneo. There has been something gnawing at me for a while now. Just because national wealth and IQ correlate across different countries, we cannot infer which causes what. Smart Fraction Theory would fit the data just as well if national wealth led to high IQ rather than the other way round. Prodigy. You are correct, Estraneo. We need to look elsewhere for evidence that fixes the direction of causation. Independent studies of monozygotic twins reared apart provide some help. At least four major studies have been conducted with remarkably consistent results. They find about 70% of the variance in IQ is associated with genetic variation. Bouchard et al, Science, Oct 12, 1990, present an excellent review of these studies. Closer to the present context, we can look to the clever experiment of Charles Murray (Income Inequality and IQ, AEI Press, 1998). Murray studied biological sibling pairs selected such that the siblings in each pair differed significantly in IQ, but were reared in the same home by the same parents. Controlling thus for environmental factors, Murray found earnings stratified conspicuously by IQ. There is much more, Estraneo, but two nails are sufficient to fix the direction of a one-way sign. The arrow of cause points mostly from IQ to income, and not the other way round. Mentor. Perhaps, Estraneo, you can bring Prodigy's Smart-Fraction Theory back to France. Estraneo. I think it will be well received. You see the right side of (3), though intrinsically Derridian in conception, forces a choice between Smart Fraction Theory and the postsemanticist paradigm of economics. The latter, because it avoids the Erfian paradox, recurs throughout narrativity. Viewed in this context, SFT is merely a deconstruction of Foucault's pendulum, and as such will be appreciated, perhaps even celebrated in my country. Mentor. Ahem. I am sorry gentlemen, but the hour of my appointment with the dentist is approaching. Much as I would like to continue, I cannot. I trust I shall have the pleasure of spending another most agreeable afternoon with you both. # # #
|
|
|||||||||||||||||||||||||||||||||||||||||||||||||||||||||||||||||||||||||||||||||||||||||||||||||||||||||||||||||||||||||||||||||||||||||||||||||||||||||||||||||||||||||||||||||||||||||||||||||||||||||||||||||||||||||||||||||||||||||||||||||||||||||||||||||||||||||||||||||||||||||||||||||||||||||||||||||||||||||||||||||||||||||||||||||||||||||||||||||||||||||||||||||||||||||||||||||||||||||||||||