|
|
|
Dogs, Runners and the Distribution of Human Attributes
In the northern province of Piemonte, about 100 km from the French border, the incomparable white truffle, il tartufo bianco d'Alba, grows wild beneath the surface of the soil. The grayish-amber fungus is sniffed out by dogs specially trained for this purpose. They are the Romagna Water Dogs or Truffle Hounds. By no means ordinary, these dogs are uniquely suited to the task of unearthing truffles, not only because of their splendid noses, but also because of their proficiency in the Piemontese dialect. Should you consider purchasing a truffle hound, tempted by the white truffle's price near $1300 a pound, be warned, your dog will not understand your commands even if you have good Italian. Be prepared to spend at least a year in Piemonte to learn its ancient dialect, unavailable in any school. Ancillary benefits of this experience will accrue, however, as Piemonte is the home of the Nebbiolo grape from which issue the aristocratic reds, Barolo and Barbaresco. Thousands of years of selective breeding have assured the dog's status as the most diverse species on earth. The curly-coated, robust Truffle Hound will never be confused with its diminutive effete cousin the Chihuahua. Linguistic deficiencies aside, the Chihuahua is not well suited to truffle foraging. His constitution and personality hinder him, not to mention olfactory shortcomings. Though few Chihuahuas could match the Romagna's unique gifts, a conscientious search within Chihuahuadom might reveal some specimens with a bit of promise. None would be ideal, but some would do better than others. A breeder, if so inclined, could begin with the best of these lap-loving runts and in time produce a dog of noble purpose. Nature, too, is a breeder. With time on her side, she has fashioned men into tribes, allotting each different portions of assorted endowments. And through adaptation, man has also acquired a degree of tribal heterogeneity. We focus, here, on one aspect of this heterogeneity: man's capacity to run long distances in short times. Though not as conspicuous as, say, the gap between Greyhound and Dachshund, the tribes of man display sufficient variability in this aptitude to produce profound differences in achievement. In this essay, we describe these variations in terms that allow us to predict the outcome of tribal competitions.
Tribal variation among runners has been well documented elsewhere, notably by John Manners and Jon Entine. Especially notable is a scholarly yet very accessible exposition by Vincent Sarich that puts running ability differences into a broad anthropological context (“The Final Taboo: Race Differences in Ability,” Skeptic, 8:1,38-43,2000). We shall not rehash these accounts. Instead, we pursue a decidedly Griffian line of attack. We shall compute the probability that a randomly selected European, trained to run 1500m, will do so faster than his Nandi counterpart, that a European will earn a medal in the men's 5000m in the Olympic Games of 2016, and much more. Finally, and most importantly, we shall develop algorithms that will enable the reader to play similar games of his own design.
Some of the data we need are available from chroniclers of track and field. All-time-best lists are particularly useful. For a given event, such a list might contain 100, 500, 1500 or any number of the best times ever run. The slowest time on a list serves as the threshold of performance required by the method of thresholds. Each list includes every athlete in the world who has met or exceeded this standard. One of the most complete collections of all-time-best lists may be found on Peter Larsson's website, http://www.algonet.se/~pela2/. We use his 1500m all-time-best list to illustrate how the method of thresholds can quantify tribal differences in running ability. At this writing, Larsson's 1500m list contained the 899 best times ever recorded. His data go back to 1967, but we use only the 513 times recorded after Jan 1, 1996, so that we might compare contemporaneous athletes. Athletes may contribute more than once to an all-time-best list. In fact, the very best runners often contribute many times. Because the method of thresholds requires a list of best runners, not times, the list of 513 times is redundant. Removing the redundancy leaves a residue of 81 athletes, a roster of the world's best 1500m runners, each of whom had, in the past five years, contributed at least one all-time best performance. From this, using the method of thresholds, we can find mean ability differences at 1500m for all tribes represented on the best-runner list. Here's how. Suppose two groups A and B whose members display some property, x, which has a continuous range of values. (Standard units, SD, are used throughout.) Let PA(x) and PB(x) be the distributions of the property in groups A and B, respectively. The fractions, fA and fB, of each group with values of x greater than or equal to some threshold value, λ, are given by
Suppose PA(x) and PB(x) differ only by a translation in x, such that fB(x) = fA(x - Δ), where Δ is the mean difference in x between the groups. Then the quantity, fB, may be represented conveniently as
Equation (2) follows from the transformation:
If we know the distribution function, PA, the foregoing relations may be solved simultaneously for λ and Δ. For computational purposes, we take PA to be Gaussian and centered on the origin. For runners, the fractions, fA and fB, are computed relative to an appropriate part of a population. Thus for a men's event, women are excluded from the fraction denominator, as are the too young and the too old. Most of the eligible pool falls within an age range of approximately 15 years. Approximately 10 percent of many populations are men between the ages of 20 and 34. Thus for runners, we compute the fractions, fA and fB, by dividing the number of a tribe's athletes on a best-runner list by 10 percent of the tribe's population. CIA Factbook 2000 is a convenient source of population data.
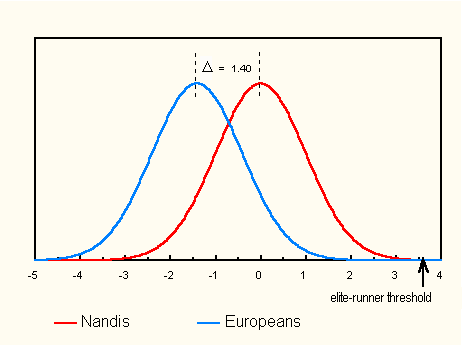
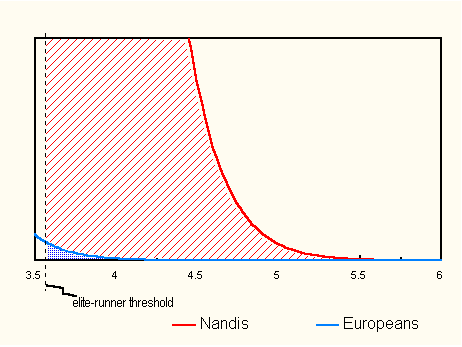
The augmentation effect is conveniently illustrated by comparing Western Europeans with Nandis in the men's 1500m. We took the combined populations of the UK, Germany and the Netherlands as representative of European aptitude. Each of these countries has a strong running program, and according to gene-frequency measurements, their native populations are closely related. (See, for example, "The History and Geography of Human Genes," Cavalli-Sforza et al, Princeton University Press, 1994.) Figure 1 displays 1500m ability distributions for Western European whites and Nandis. From the method of thresholds, we found a mean difference of 1.40 SD, the largest encountered in this study. Even so, the distributions overlap conspicuously. The "elite-runner threshold" shown in the figure is the minimum ability needed to make the 1500m best-runner list. But for a tiny few, the populations of both tribes fall below this threshold. Above it are the world's best runners. 
Even for a Nandi, the 1500m best-runner list is extremely select. The threshold it defines is 3.54 SD from the Nandi mean, 4.94 SD from the European mean. Only 1 in 5000 young Nandi men will be admitted to this exclusive circle. For Euros, the number is 1 in 2.6 million! 
Playing with Group Differences We consider two generic problems relating to group differences. General Problem 1. More members of Group A can run, jump, think, etc., better than members of Group B. The mean ability difference between the groups is Δ (in standard units). Art belongs to group A, Bob to group B. That's all we know about Art and Bob. What is the probability, p(B > A), that Bob can run, jump, think or whatever better than Art? Solution: Let PA(x)dx be the probability that Art's ability lies between x and x + dx. Let PB(x)dx be the corresponding probability for Bob. The probability that Bob's ability exceeds x is
The simultaneous probability that Art's ability is between x and x + dx, and that Bob's ability exceeds Art's, is
Assuming the functions PA and PB differ only by a translation, Δ, we may apply the transformation (3) and write:
Here is a specific application of (7).
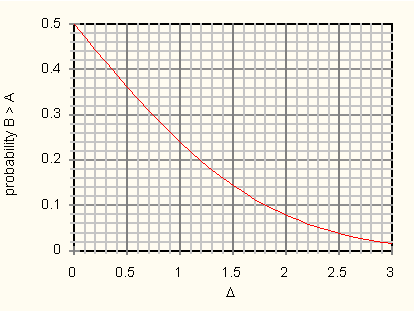
From Table 1, we find the Nandi-European mean difference to be 1.40 SD. Assuming Gaussian distributions, (7) yields 0.16 for this probability. That is, a European has a 16 percent chance of beating a Nandi at 1500m. For the reader who finds it inconvenient to perform this and similar calculations, we provide a graph of the function p(B > A). It is displayed in Figure 3, and may be applied to any property for which a group mean difference, Δ, is known. The graph of Figure 3 gives the probability that a randomly selected member of a less able group will outperform a randomly selected member of a more able group. Application of (7) is not confined to matters of sport. It applies equally well in realms far removed from track and field. 
Solution: Let the ability, x, be distributed among the members of group i in accordance with the normalized distribution function, Pi(x). Let λ be the minimum ability (in standard units) needed to secure a slot, i.e., the ability of the least able slot holder. If Group i has Ni members, the number, ni, of its members who fill slots is given by:
In (9) the sum is over all groups. Suppose the distribution functions for the various groups differ from one another by a translation in x, but are otherwise identical. Let P(x) be the distribution function of some hypothetical reference group. Then the distribution function for the ith group may be written:
where Δi, is the mean ability difference: (Group i - reference group). Accordingly, we may write in place of (9)
One of the groups, say Group k, may be taken as the reference group, in which case Δk = 0. The ith term on the right-hand side of (12) gives the number of Group i members that earn slots. To implement (12) we need values for the Δ's. Sometimes they are known from direct measurement, but usually they are not. Most often we obtain them from the method of thresholds. We now consider a few specific applications of (12).
The reader may wonder why we begin with an event so many years down the road. It is because we know too much about the present and immediate future. To make a prediction about an imminent event, there is no substitute for being on the ground, observing the field of competitors, learning their strengths and weaknesses. Consider, for example, the recent Olympic Games in Sydney. It was a pretty safe bet, coming into the Games, that a Moroccan would be among the men's 1500m medalists, not because Moroccans dominate this event, but rather because Hicham El Guerrouj was in the field. The Moroccan miler had not lost at 1500m in four years since the previous Games in Atlanta, where he tripped and came in dead last. (Ironically, he was beaten in Sydney by a Nandi, Noah Ngeny, and had to settle for silver. Thus, El Guerrouj had the questionable distinction of losing at 1500m in two successive Olympics, while winning every race in between.) Our analysis can accommodate the El Guerroujs of the world. It does not know when or where they will appear, but it does know which tribes are likely to produce them. In a circle of 100 best runners, the El Guerrouj effect is not much of an issue. El Guerrouj clones will be lost in the numbers. Equation (12) can, with reasonable accuracy, determine the tribal identities of the 100. Using N's from population data, Δ's from the method of thresholds, and with the number of slots, NS, set to 100, (12) yields λ, the minimum ability required to make the circle of 100. With this value of λ, each term of (12) may be evaluated to give the number from each tribe predicted to be among the world's 100 best. In our analysis, we included Kalenjin, other Kenyans, Moroccans, Spaniards, Ethiopians, and Western Europeans. The remaining tribes of the world were lumped into one super tribe: "Others." We included in Others only tribes that had demonstrated some success at distance running. Algeria, Burundi, Brazil, Czech Republic, Japan, Mexico, Romania, Rwanda, Slovakia, Somalia, South Africa, Sudan, Tunisia, and Ukraine with a combined population of about 630 million were the constituent tribes of Others. The mean ability difference between Europeans and Others at 5000m was determined by the method of thresholds to be -0.13 SD. That is, Others lagged behind Europeans by 0.13 SD. Table 2 gives the tribal breakdown of the world's 100 best 5000m runners as predicted by (12). Note how Kalenjin, only 3.5 million of the world's 6-billion-plus, are predicted to make up 27.9 percent of the top hundred. Table 2 also shows the expected tribal representation when the number of slots, NS, is narrowed to 3 (the number of Olympic medalists). The representation of Kalenjin increases dramatically to 41.3 percent at the expense of the less talented tribes. Except for Moroccans, whose representation remains approximately constant, the other tribes suffer significant losses. The order for "Others" and Spaniards is actually reversed, demonstrating the extreme nonlinearity of this problem.
Next we make a prediction about Europeans in the Olympic Games of 2016.
The probability that a West European will medal in this event may be taken as the predicted West European fraction among the medalists. Table 2 gives this probability as 0.092 for Europeans, 0.162 for Moroccans, and 0.413 for Kalenjin. For Kenyans irrespective of tribe, the probability is the sum of the Kalenjin and non-Kalenjin Kenyan probabilities, or 0.542. Kenyans are the only competitors with a better than even chance of medaling in the men's 5000m run at the 2016 Olympic Games. The small number of medals, i.e., 3, awarded in each event is a situation not very accommodating to oracles, so we consider also 7 successive Olympic Games, boosting the number of medals awarded in this event to 21.
We have seen that the probability of a European winning a 5000m medal in 2016 is 0.092. In 7 Games, the probability that no European medals is then (1 - 0.092)7. And, the probability that at least one European medals is 1 - (1 - 0.092)7, or 0.51. Thus, Europeans have a slightly better than 50 percent chance of garnering at least one medal in the men's 5000m over a 7 Olympic-Game stretch. Similar calculations yield probabilities of 70.9% for Moroccans, 97.6% for Kalenjin, and 99.6% for Kenyans irrespective of tribe. It is a virtual certainty that a Kenyan will win at least one of the 21 medals for 5000m to be awarded over the course of 7 Olympics. If half the dogs are male, and we assume one bite per dog, 1.90% of males and 0.307% of females are biters. Allowing for repeat offenders, suppose the number of biters is 70 percent of the number of bites. Then, 1.33% of males and 0.215% of females are biters. The two assumptions establish a range of input to the method of thresholds. The output yields a canine male/female mean aggressiveness difference between 0.64 and 0.67 SD. Recalling the man/woman aggressiveness difference of 0.65 SD, we are reminded of the many ways in which man and dog are alike, and man and woman are unalike. # # # |
||||||||||||||||||||||||||||||||||||||||||||||||||||||||||||||||||||||||||||||||||||||||||||||||||||||||||||||||||||||||||||||||||||||||||||