|
||||
|
HOME Write |
SMART FRACTION
THEORY II:
Mentor. Come in, Prodigy, welcome! Prodigy. Thank you, Mentor. I brought a friend, Estranea. You may remember her twin brother, Estraneo. Mentor. I do indeed. Welcome Estranea! Estranea. I am honored to be here and delighted to meet you at last Mentor. Mentor. Prodigy tells me he will unveil a major refinement of smart fraction theory this morning. Did you know your brother was here when Prodigy introduced the original theory? Estranea. I did. Mentor. Then you know your presence adds a bit of symmetry to the occasion. I like symmetry, so thank you for coming. I recall Estraneo was studying at the Sorbonne. Estranea. Yes, our careers have progressed in a parallel fashion, though I lean more toward obscurantism than Estraneo. I just submitted my thesis for the doctorat du troisième Mentor. Congratulations! Estranea. It is titled Lacanist Obscurity in the Works of La Griffe du Lion. I demonstrate how La Griffe can be interpolated into consciousness as a type of deconstruction. Mentor. Sounds exciting. Prodigy. Ahem ... I promised to mow Aunt Patricia's lawn this afternoon. Perhaps I should begin my presentation before it rains. Mentor. I'm sorry Prodigy. Tell us what you have done with smart fraction theory. Prodigy. Let me begin at the end--with my most important result:
Mentor. Verbal IQ?! Can you demonstrate this proposition? Prodigy. About as well as anything in social science can be demonstrated. Estranea. Excuse me, Prodigy. Advances in poststructuralist feminism have kept me so busy, I'm afraid I haven't been able to keep up with smart fraction theory. Would you mind reviewing it briefly for me? Prodigy. It's quite simple, Estranea. Smart Fraction Theory recognizes that smart people produce wealth. It asserts that a nation's per capita GDP varies directly with the fraction of its population that is smart. SFT II changes the definition of "smart" by linking it to verbal IQ instead of general IQ. SFT II asserts:
Estranea. Why market economies? Prodigy. SFT describes a relationship between wealth and intelligence. A nation's wealth, however, depends on other variables as well. Economic system is one of them. Communist economies, for example, are not competitive even with a very smart population. Thus, if we seek the relationship between GDP and IQ, we must control for economic system. Estranea. How did you come up with 106 as the threshold that determines who is "smart?" Prodigy. I'll explain soon, please be patient. Estranea. What do you mean by "verbal IQ?" Prodigy. Verbal IQ is a score derived from verbal subtests of an IQ test. The subtests measure abilities like abstract and common sense reasoning, language comprehension, short-term auditory memory, concentration, attention, word knowledge, verbal fluency and social judgment. It is the kind of intelligence that serves lawyers well. I actually prefer the term "verbal-analytical IQ." Mentor. I recall that SFT I explained observed GDPs quite well. What motivated your revision? Prodigy. SFT I quantitatively accounts for the link between GDP and IQ for most countries, but it overpredicts GDPs for Northeast Asians. "Why" has been gnawing at me. Now the problem is solved. Estranea. By using verbal IQ instead of general IQ? Prodigy. Precisely. Estranea. What is it about NE Asians that makes them different from other racial groups? Prodigy. Their IQ is bifurcated. NE Asians have the highest IQ of all peoples other than Ashkenazim. They owe that superior IQ, however, to extraordinary visuospatial ability, which, despite verbal shortcomings, lifts their IQ above that of Europeans. The bifurcation is evident in the workplace where, for example, fully-assimilated second and third generation NE Asian Americans are overrepresented in science, medicine and engineering, and underrepresented in law, social science and the humanities. According to the 1999 National Science Foundation survey of PhDs awarded to US citizens and permanent residents, Asian Americans earned 11% of the science and engineering PhDs but less than 5% of other PhDs. Estranea. What do you mean by "verbal shortcomings." Is it that NE Asians perform less well than Europeans on verbal subtests or that they simply are not given to Strocchian pleonasm? Prodigy. The former, but there is other evidence of their verbal deficiency. Take the bar exam for example. In 1989, the Law School Admission Council commissioned a study of bar passage rates. Its report, The LSAC National Longitudinal Bar Passage Study was published in 1998, with results disaggregated by race and ethnicity. Linda F. Wightman, the project head, collected data from more than 27,000 students who entered ABA approved law schools in fall 1991. The study found that only 80.75% of Asians passed the bar on the first try compared with 91.93% of non-Hispanic whites. This corresponds to a white-Asian mean-score difference of 0.53 standard deviation or in IQ terms a verbal gap of 8 points! Unfortunately, Wightman put NE Asians into one big Asian box along with Filipinos, Hmong and others whose IQs are more than a standard deviation lower than Chinese, Koreans and Japanese. It is true that relatively few from low-IQ groups make it to the bar exam, but some do. Consequently, 8 points must be regarded as an upper bound to the white-NE Asian verbal gap. Mentor. Is there more direct evidence of the verbal gap? Prodigy. Plenty. R. Lynn reviewed the literature on racial IQ in The Mankind Quarterly, 31:3, Spring 1991, 255-296. IQ averages for Caucasoids, Mongoloids, Negroids, Negroid-Caucasoid hybrids, Amerindians and South East Asians were reported. More than 100 studies were referenced, most from peer-reviewed journals and not a small number from Lynn himself. Of these, 12 reported both general and verbal IQ averages for NE Asians. Three of the 12 indicated a white-NE Asian verbal IQ gap of about 8 points in agreement with the bar exam result, but these are at the high end. The average verbal gap was a bit less than 4 points or about a quarter standard deviation. Mentor. Because you are replacing "general IQ" with "verbal IQ" in SFT, isn't it more to the point to know the difference between these quantities for each race? Prodigy. It is indeed, Mentor, and I was just going there. Among the races, only NE Asians and Amerindians exhibit this particular kind of verbal-nonverbal cognitive split. For other races verbal and general IQ averages have similar values, making the distinction between the two transparent to smart fraction theory. In the 12 studies reporting both general and verbal IQ for NE Asians, the general-verbal gap averaged 6.5 IQ points. Estranea. I see where you're going. To estimate verbal IQ averages you subtract 6.5 from NE Asian averages leaving all other IQs unchanged. Prodigy. Exactly. Estranea. Can you say why NE Asian IQ splits along verbal-nonverbal lines? Prodigy. We can make a pretty good guess. In all his versions, Man is the product of adaptation to environments that existed more than 50,000 years ago. Africa, Europe and Asia presented three distinct adaptational challenges resulting in three major races: Negroid, Caucasoid and Mongoloid, each differing from the other in certain physical, mental and psychological aspects. Mongoloids, for example, developed heat-conserving physical features like flattened faces, short limbs, epicanthic folds and narrow eyes as responses to the extreme Siberian cold prevalent in the Fourth Ice Age. In his book Race, Evolution And Behavior J. P. Rushton writes, "Under these adverse conditions natural selection [also] increased general intelligence and a trade-off in favor of visuospatial abilities over verbal because of the crucial role of strong visuospatial abilities for making sophisticated tools and weapons, and for the planning and execution of group hunting strategies." But the spectacular visuospatial ability of NE Asians, while accounting for their high IQ scores, does not necessarily make them good capitalists. Hunting strategies have little to do with wealth production. And a new tool, irrespective of point of origin, is now soon available worldwide. The structure of NE Asian intelligence did not come about in response to pressures to be attorneys or editors or production managers or copywriters or salesmen or programmers or systems analysts or insurance adjusters or purchasing agents or account executives. The harsh prehistoric Siberian climate did not select for capitalist alleles. Mentor. I see you brought some charts. May we see them? Prodigy. I was just about to show them, Mentor. Recall I developed smart fraction theory to account for data gathered by Lynn and Vanhanen in their book IQ and the Wealth of Nations. The authors report IQ measurements for 81 countries. Of these, nine are either communist or recently-communist, including China, Cuba and the Eastern Bloc countries of Bulgaria, Romania, Slovakia, Russia, Czech Republic, Poland and Hungary. The other 72 have market economies. One, however, Qatar, sits on a huge oil deposit that has endowed its tiny (less than a million) population with a huge income completely unrelated to its 78 average IQ. Its wealth being thus thrust upon it, Qatar does not belong in this or any other analysis of how wealth relates to intelligence. Figure 1 is a plot of per capita GDP for the market economies (minus Qatar) in the Lynn-Vanhanen data set versus average IQ. 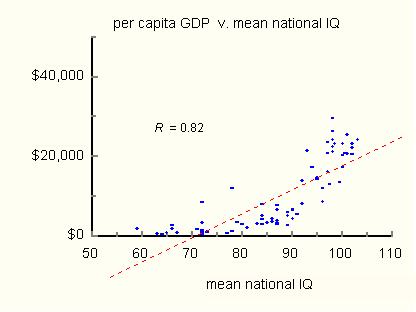
Mentor. Which points belong to NE Asians? Prodigy. In Figure 2, the points are broken down by race. The red triangles correspond to South Korea, Hong Kong, Taiwan and Japan, the four homogeneous NE Asian polities included in the data set. 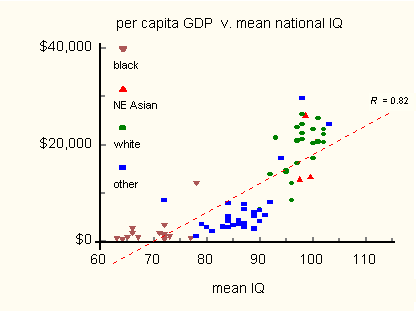
Points labeled "other" include South Asian Indians, Latin Americans, Pacific Islanders, Middle Easterners and Asians not of the Northeastern variety. Estranea. I see nothing remarkable about the NE Asian points. Many other countries have greater residuals. What am I missing? Prodigy. No line can adequately describe the nonlinear character of the relation between per capita GDP and mean IQ. Consequently, deviations from the regression line reveal little. Estranea. Why then include it? Prodigy. For reference. Per capita GDP versus IQ is clearly nonlinear. But, according to smart fraction theory, per capita GDP is linearly related to smart fraction. Thus, when switching independent variables from IQ to smart fraction, we should see a significant improvement in the correlation. According to SFT, a nation's per capita GDP varies directly with the size of its smart fraction. That is,
Estranea. Measured IQs are tabulated, but where do you find smart fractions? Prodigy. If we know the threshold IQ that defines "smart" and the distribution of IQ in a population, we can calculate its smart fraction. I assumed Gaussian distributions of IQ in each country, which for racially homogeneous countries is OK, but is less valid in racially heterogeneous nations. Estranea. And how do you find the threshold IQ? Prodigy. Simple. Regard a country's smart fraction as a function of <Q> (its mean IQ) and Q0 (the threshold IQ). That is,
Estranea. How well does SFT account for the data of Lynn and Vanhanen? Prodigy. We can see by looking at a plot of per capita GDP versus smart fraction. According to SFT it should be a straight line through the origin. Figure 3 shows the plot using smart fractions derived from Lynn and Vanhanen's observed IQs. 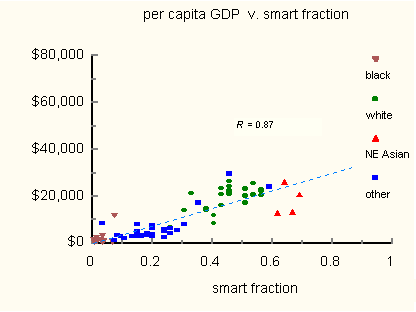
Estranea. I suppose one could make a case for linearity in Figure 3, but not a great one. Prodigy. Precisely correct, Estranea. Still worse, the deviations from linearity are systematic. Almost all the "white" points lie above the regression line, while most of the "other" and NE Asian points fall below it. Now I will show you something extraordinary! Figure 4 is the same plot with NE Asians excluded from the least squares analysis. 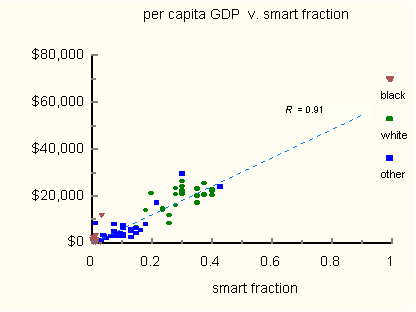
Estranea. That is extraordinary! The points now array neatly about the regression line and the systematic error is gone. Prodigy. Keep in mind also, Estranea, that smart fractions have been derived from mean IQs by assuming a Gaussian IQ distribution for each population. The error of this approximation gets folded into the error of the IQ estimates. Thus, we could not expect the scatter in the plot to be much smaller or the correlation (0.91) to be much larger. Excluding NE Asians, the linear dependence of per capita GDP on smart fraction is then established. Mentor. This is impressive, Prodigy, but I am puzzled. Comparing Figures 3 and 4, I note that removing the NE Asian points caused the other points to shift to new locations on the plot. How can this be? Prodigy. The short of it is that SFT I does not accommodate NE Asians. When fed into the least squares hopper, the NE Asian data produces a spurious threshold IQ at the other end. The bogus Q0 alters every smart fraction resulting in a spurious distribution of points on the plot. Without the NE Asian data, least squares adjusts Q0 to its proper value, resulting in a symmetric distribution of points about the regression line. Using correct values for smart fractions, the NE Asian anomaly becomes strikingly apparent, as seen in Figure 5. The four NE Asian points are isolated in a cluster outside the linear path swept out by the other points.  Figure 5. Per capita GDP v. smart fraction. NE Asian points have been excluded from the least squares analysis, ensuring correct values of the smart fractions. Mentor. As I understand it, SFT II uses a verbal IQ threshold to determine smart fractions. What happens when you throw NE Asians back into the least squares analysis using verbal IQs instead of general IQs? Prodigy. Figure 6 shows this. 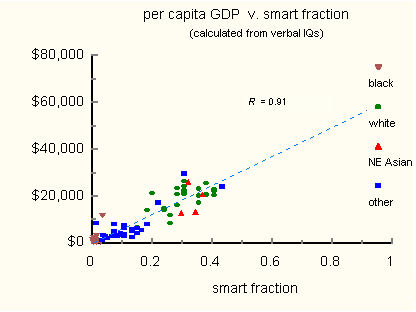 Figure 6. When smart fractions are calculated from verbal IQs, the appearance of NE Asian points is unremarkable. Estranea. Oooh, everything has come together. Mentor. Congratulations Prodigy. It seems that SFT II is fully supported by the data of Lynn and Vanhanen. Prodigy. Correct. The positions of the NE Asian points are now quite unremarkable. The proportionality constant, c, adjusts to a value of $59,955, and the IQ threshold, Q0, to 105.6. Thus:
And also:
Mentor. People don't yet think in terms of smart fractions. They are, for the moment at least, wedded to the notion of IQ. So, for them, what does SFT II predict for per capita GDP as a function of mean verbal IQ? Prodigy. I've saved this for last. Figure 7 shows the curve of predicted GDPs along with the Lynn and Vanhanen data on the same plot. You can judge the fit for yourself. 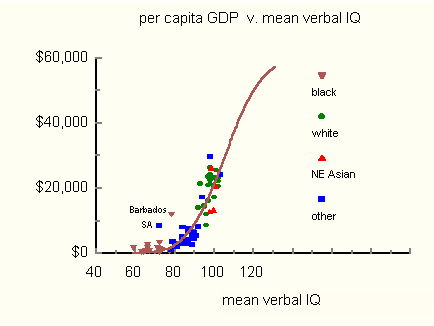 Figure 7. Per capita GDP v. mean verbal IQ. Data of Lynn and Vanhanen. The solid line is the GDP predicted by Smart Fraction Theory II. Mentor. I see you have marked two outliers: South Africa and Barbados. Are these statistical fluctuations? Prodigy. We cannot be sure. South Africa is the world's largest producer of platinum, gold, chromium, and diamonds, with an economy set up and largely maintained by Europeans. Its wealth is heavily influenced by these factors which may account for its higher than predicted GDP. Barbados is more problematic. It is tempting to attribute its high (for its IQ) GDP to the fact that it is blessed with exceptional year-round climate, proximity to the US, and an American-managed tourism industry. But then one could ask: "What about Jamaica?" Lest I be accused of cherry picking I included both South Africa and Barbados in the analysis. Mentor. Would their exclusion change the parameter values? Prodigy. Not really. The verbal IQ threshold defining the smart fraction would remain at 106, and each percentage point increase in the smart percent would be worth $622 (1998) to per capita GDP instead of $600. Estranea. This is amazing stuff Prodigy! Have you thought about the economic consequences of the verbal IQ threshold? For example, the dimmest bulbs in a nation's smart fraction have verbal IQs near 106. What kind of jobs can these folks do? Prodigy. We have data for general IQ, but because verbal and general IQ averages are similar for most racial groups the results carry over. According to the 1992 Wonderlic Personnel Test and Scholastic Level Exam Users Manual, at an IQ level of 106 we might expect to find bookkeepers, credit clerks, lab techs, salesmen, and secretaries. At slightly higher IQs we find registered nurses, sales account executives, administrative assistants and store managers. These people are not rocket scientists. They are, however, vital to a flourishing economy. Any nation can supply enough businessmen and CEO types, but to succeed economically it needs a cognitive core to carry its water--a smart fraction if you like. In a developed country like Belgium with an average IQ of 100, thirty-four percent of the general population makes up its smart fraction. Morocco, in contrast, has an average IQ of 85. Less than eight percent of its people are capable of doing smart-fraction jobs, a fact made plain by its dreary third-world economy. But if you think that's bad, black Africa is utterly hopeless with less than two percent qualifying for smart-fraction jobs. The demise of colonialism sealed its economic doom. Estranea. Confronted by a choice between abiding poverty and a colonial yoke, we must line up on the side of poverty. Prodigy. Ahem, this promises to become a lively discussion that I dearly would like to pursue, but faced with a choice between mowing Aunt Patricia's lawn or calming her wrath, I must line up on the side of circumspection. Mentor. I am sorry your discourse must end so abruptly, Prodigy. Estranea, please make frequent visits and say hello to Estraneo. Estranea. I would love for you to visit with my department at the Sorbonne, Mentor. You would break all attendance records if you were to lecture on Yang-Mills theory as postdialectic reality. Mentor. I will check my calendar, Estranea. Goodbye. Goodbye Prodigy. You've given me a lot to chew on today. ###
|
|||||||||||||||||||||||||||||||||||||||||||||||||||||||||||||||||||||||||||||||||||||||||||||||||||||||||||||||||||||||||||||||||||||||||||||||||||||||||||||||||||||||||||||||||||||||||||||||||||||||||||||||||||||||||||||||||||||||||||||||||||||||||||||||||||||||||||||||||||||||||||||||||||||||||||||||||||||||||||||||||||||||||||||||||||||||||||||||||||||||||||||||||||||