THE MATH
SEX GAP REVISITED: A THEORY OF EVERYONE
At
the annual meeting of Women Against the Gap,
Prodigy unveils a model of mathematical ability that
brings together seemingly isolated facts. He
demonstrates that there is a single math ability gap
between the sexes, biological in origin, and independent of race, culture and
geography. Prodigy introduces the theory of Everyone
which accounts for all
available data.
I
have no other but a woman's reason:
I think him so, because I think him so.
-- Lucetta, The Two Gentlemen of Verona
Good evening ladies. I
am truly honored to be invited to the annual meeting of Women
Against the Gap and even more so to be your featured
speaker. I always enjoy visiting La La Land where a
gap-free society defines the goal of human striving. Thank you for the invitation and for your
hospitality. I confess to some initial misgivings -- after
all, hundreds of WAGs in a single room can be
intimidating -- but your gracious welcome quickly put an
end to my fears. So, as a much-relieved featured
speaker, I look forward to sharing with you a
new analysis of the mathematics gender gap, which, if
psychologists could do Fermi problems, would be largely unnecessary.
You may
wonder why I have undertaken a new study of the
math gap since my
previous analysis
left
little room for amelioration. Two papers, published this year, are the reason.
Each, in a different way, supports the notion that
sex gaps in mathematics are malleable and
consequently erasable. As it turns out, the primary accomplishment
of these papers is to have inspired
me to develop a theory that
explains all the available data. I call it the theory
of Everyone. But before I get to it, I will comment briefly on the
two papers.
Culture, Gender and
Math, appeared in the May 30 issue of Science.1
In it, four economist authors, led by Paola Sapienza of
Northwestern University, advance the proposition that
the math gender gap is the result of gender bias, and
that the gap vanishes in gender-neutral environments.
"In more gender-neutral societies," said
Sapienza, "girls are as good as boys in
mathematics."
The
second paper, Gender Similarities
Characterize Math Performance, was published two
months later in the July 25 issue of Science2.
Its five feminist authors, led by Janet Hyde, Professor of
Psychology and Women's Studies at the University of
Wisconsin, claim that a math gender gap no longer exists in the U.S.
Both
papers generated excitement in the media. But
beneath the headlines the level of discourse was less than
learned. ABC News announced that "Romona
and three classmates are building a robot
together. A few buildings away, younger girls are
playing 'Environmental Science Jeopardy' with
their teacher." Their flaws notwithstanding,
the papers deserve a more thoughtful
appraisal than can be offered by an entertaining
but innumerate press. So allow me one or two minor observations.
"Gender
Similarities Characterize Math Performance"
Noted feminist scholar Janet Hyde is a veteran gap
buster. She is also a prominent sexologist as well as principal
author of Gender Similarities Characterize Math
Performance.
She's been in the gap-busting business for more than 20
years, but only after decades of
determined effort did she succeed in showing that
a mathematics gender gap does not exist.
Hyde
et al. analyzed a
huge database of standardized test data from
state assessments mandated by the No Child Left Behind
initiative (NCLB). Records from 10 states and 7 million
students in grades 2 through 11 yielded a
math gender gap of 0.0065 SD in favor of boys -- trivial
by
any yardstick. For all intents and purposes there
was no gender gap. "Our
analysis shows that, for grades 2 to 11, the
general population no longer shows a gender
difference in math skills," concluded the
authors.
The
problem here is one of sophism rather than error.
Sex gaps favoring boys
are not fully developed until the onset of
puberty. In lower grades, math gaps are often non-existent or
favor girls. By including data
from the lower grades, Hyde's estimate of the gap
was much too low. The average gap in grades 2 through 8
was 0.0054 SD. Data from post-pubescent students in grades
9, 10 and
11 were an order of magnitude greater. Ironically, it
was Hyde herself who, in 1990,
with
co-investigators Fennema and Lamon3, performed
a meta analysis
confirming that significant math gaps first appear
at puberty. They wrote: "There
were no gender differences in problem solving in
elementary or middle school; the differences
favoring men emerged in high school (d
= 0.29) and in college (d = 0.32)."
(The quantity, d, is the "effect
size" or difference between the means
expressed in standard deviation units).4
Other
problems plague the Hyde paper. NCLB assessments,
for example, are ill suited to the job of
assessing the math gender gap. Rather, they are
designed to assess whether a student has reached
some minimum
level of proficiency. None of the
questions require complex problem solving skills
-- the
domain where sex differences are most apparent. As a result, NCLB tests
underestimate
sex gaps. Hyde et al. addressed
this issue by turning to the somewhat more difficult National Assessment
of Educational Progress (NAEP) tests. There too,
however, they could find no complex problems. They
did manage to harvest some moderately difficult
questions from the NAEP set, from which they
obtained gender gaps of 0.07 SD and 0.05 SD in grades 12
and 8, respectively -- both in favor of boys -- and also an
order of magnitude greater than the NCLB gaps
reported for
grades 2 through 11. None of this appeared in the
paper's conclusion or in post-publication
publicity.
Male
variability
Another issue improperly construed in the Hyde paper
was that of male variability.
In statistical terms, the distribution of many
psychological traits, including mathematical ability, is wider in men than in women.
This variance discrepancy is evident at all ages. NCLB data revealed a
boy-to-girl variance ratio greater than unity in every
grade, with values spreading narrowly about a mean of 1.15.
Disparate variances can result in disparate
performance, so Hyde et al.
addressed the issue:
All [variance ratios], by state and grade, are >
1.0 [range 1.11 to 1.21...]. Thus, our analyses show
greater male variability, although the discrepancy in
variances is not large.
But
what does "not large" mean? Since psychologists don't do Fermi problems, I will
lend a hand. Hyde et al. set the context for
the meaning of "not
large" in their opening sentence:
Gender differences in mathematics performance and
ability remain a concern as scientists seek to address
the underrepresentation of women at the highest levels
of mathematics, the physical sciences, and engineering.
And again
in their conclusion:
There is
evidence of slightly greater male variability in scores,
although the causes remain unexplained. Gender
differences in math performance, even among high
scorers, are insufficient to explain lopsided gender
patterns in participation in some STEM [science,
technology, engineering, and mathematics] fields.
"Not
large," then, means that the
male-female variance difference exerts negligible influence on the number of women
with sufficient cognitive resources to function "at the highest levels
of mathematics, the physical sciences, and
engineering." We ask then: What numerical ceiling does a variance ratio of 1.15 impose upon
women in these fields?
For
definiteness, consider tenured faculty in math-intensive
departments of research universities.
Approximately 14,000 doctorates
are awarded in these fields each year. (The precise number in not
important.) If we assume an average of one new Ph.D. per
year per tenured faculty member, the number of
doctorates granted roughly equals the number of faculty
positions to fill. The pool of US residents
from which these faculty are drawn is, by and large, that
segment of the population between the ages of 25 and 65.
Of these, about 81 million are women and 79 million men.
Consider 2 cases:
Case I. All 160 million men and
women compete for the 14,000 tenured positions, the seats
being filled
in rank order of ability. The ability distributions of
men and women in the 25 to 65 year-old cohort will sort out who gets
tenure.
Of course, this
case will not obtain. Some (perhaps many)
able men and women will find rewarding work elsewhere.
So, consider Case II.
Case II.
One in ten with the
required talent chooses to compete in this segment of the marketplace.
(In the rank order calculation this is equivalent to
expanding the number of tenured positions 10-fold to
140,000 (still in the top 0.1% of the adult population).
Somewhere between Cases I
and II lies the truth. The two cases give us bounds on
the ceiling imposed by the variance ratio.
Finding the bounds is straightforward.5
With a male-to-female variance ratio of 1.15 and zero gap
in the means, filling tenured faculty slots in rank
order of ability imposes the following bounds:
Case I: No more than 26% of faculty positions
will be occupied by women.
Case II: No more than 33% of faculty positions
will be occupied by women.
Thus, "the discrepancy in
variances is not large" means that it only restricts female
participation in this segment of the marketplace to between 26% and 33%.
And we have
not considered the sex gap in the means. Accounting for
it, the bounds drop to between 16% and 22%.
The
foregoing bounds are imposed by ability limitations, but ability is not the
whole story, perhaps not even the main story. Sex differences
in psychology influence occupational choice. Benbow et al.6
performed the definitive study of occupational
preferences in mathematically gifted individuals. They
tracked 1,975 men and women, identified at age 13 as mathematically
gifted (top 1%), and surveyed them 20 years later at age
33. Interesting sex differences emerged in their career
choices. Of the 26 percent that proceeded to
the doctoral level, men entered
math-intensive fields at five times the rate of women.
Women frequently chose
careers in the life sciences and medicine, as well as in the
social sciences, arts and humanities. If we incorporate this
proclivity factor of 5 into the rank-order
calculation, the ceiling on tenured
women faculty in math-intensive fields at research institutions
drops to between 4% and 6%. In elite departments, say the
top five, the ceiling will be lower still. Prenatal testosterone supplements
might improve the numbers.
A
lesson in casuistry
A persistent sex gap favoring boys in the math SAT
is a gap buster's nightmare. At odds with the claim of a nonexistent math gap, Hyde et al. needed to address this
matter. They did so in an online supplement
writing:
Gender differences in performance on the SAT
Mathematics test are widely publicized and contribute to
the public's view that males excel in mathematics,
compared with females. In 2007, males scored an average
of 533 ± 114 (mean ± SD = 114) on the Mathematics
portion of the SAT, compared with an average of 499 ±
111 for girls. For many reasons, these data tell us
nothing about gender differences in mathematics
performance. Chief among these reasons is sampling. The
SAT is taken almost exclusively by college-bound
students, and even then, some college-bound students do
not take it because their intended college requires some
other test such as the ACT. Therefore, there is no
well-defined sampling frame that would permit broader
generalization. Perhaps more important is the fact that,
coupled with the current trend for more females than
males to attend college, the SAT is taken by more
females than males. In 2007 the SAT was taken by 798,030
females but only 690,500 males, a gap of more than
100,000 people. Assuming that SAT takers represent the
top portion of the performance distribution, this
surplus of females taking the SAT means that the female
group dips farther down into the performance
distribution than does the male group. It is therefore
not surprising that females, on average, score somewhat
lower than males. The gender gap is likely in large part
a sampling artifact.
All of the
above is true, even the
conclusion that "the gender gap is in large part a
sampling artifact." So what if anything is wrong with this analysis?
In 2007, 23,281
boys scored 750 or better on the math SAT compared with
11,852 girls. At this, the
highest level of achievement reported, boys outnumbered
girls 2 to 1. It is true that adding girls
to the low end will lower the girls' average. It is
also true that many if not most college bound students
in ACT states do not take SATs. And yes, it is true all
this introduces significant sampling problems.
But none of this has anything to do with the 2 to 1
ratio of boys to girls in 750 plus territory. That has to
do mostly with male variability. Happily, Hyde et al.'s
paragraph can be repaired easily by replacing "these
data tell us nothing about gender differences in
mathematics performance" with "the full SAT data confirm the male advantage
in mathematical ability."
Hyde et al. continue:
This conclusion [that the gender gap is in large part
a sampling artifact] is verified by results from a study
of the ACT. It, too, is taken by a selective group of
college-bound students. Traditionally, males have had a
slight advantage of 0.2-0.3 points on the composite
score. In 2002, two states, Colorado and Illinois,
mandated the administration of the ACT to all high
school students in those states. ... The gender gap in
scores disappeared when the test was administered to all
students and, in fact, a slight gap favoring females
emerged. These findings support the conclusion that the
male advantage on the SAT mathematics test is largely an
artifact of sampling.
The ACT composite score is
a weighted average of English, math, reading and science scores. In Colorado and
Illinois, where there are no sampling problems, as well
as nationally where there are, girls
outscore boys in English and reading, while boys outscore
girls in math and science. And, as in SATs, boys
outnumber girls 2 to 1 in the highest ACT levels of
mathematics achievement.
By making use of the Colorado and
Illinois ACT data we can estimate the effect of
sampling error. In 2007, the gender gap
nationally on the math ACT was 0.21 SD. The same year in Colorado and
Illinois, absent sampling error,
the gaps
were 0.13 SD and 0.16 SD, respectively. The difference
between the national and full-cohort gaps is the
contribution of sampling error to the math gap. Thus,
"largely
an artifact of sampling" means that sampling errors
caused the gender gap to be overestimated by approximately 0.05 to 0.08
SD, leaving behind a generous gap of between 0.13
and 0.16 SD, remarkably close to those we shall
presently reveal. Sampling error not
withstanding, the math gap proves durable.
"Culture, Gender and Math"
The second paper, Culture, Gender
and Math, actually appeared in Science
two months earlier than the Hyde paper. Its authors were
not veteran gap busters, but
rather economists on a brief excursion into La La
Land.
Luigi Guiso, Ferdinando Monte, Paola Sapienza and
Luigi Zingales concluded that the sex gap in mathematics
is
cultural in origin and therefore erasable. In fact, they
maintain, it has already been erased in a few gender-neutral
countries. These conclusions were drawn from correlations
between gap sizes and measures of women's
emancipation, or, as they put it, gender neutrality.
Guiso et al. also looked at the effect of gender neutrality on the
reading-comprehension gap where women enjoy
a substantial advantage. They summarized their findings
writing: "In more gender-equal
cultures the math gender gap disappears and the reading gender gap becomes
larger."
The Guiso
research team analyzed test scores from standardized tests offered to teenage students in
many countries. Because the
degree of women's emancipation generally differs from
country to country, the opportunity to find relationships between mathematical proficiency and gender
neutrality presented itself.
Guiso et al.
looked test scores from the Program for
International Student Assessment (PISA). These tests are
designed to assess,
cross-nationally, student competencies in
science, math and reading. They are given triennially to
representative
samples of adolescent students ranging in
age from 15 years 3 months to16 years 2 months. In 2003, approximately 300,000 students
from 41 countries took the tests, increasing
to 400,000 students from 57 countries
in 2006. Guiso et al. looked at the 2003 data.
To carry out the analysis,
the researchers needed a gauge of national gender neutrality. They found
four highly
correlated measures. Of these, the
Gender Gap Index (GGI), an instrument developed by the World
Economic Forum in 2006, produced the largest correlations with
sex differences in math performance.
The
GGI employs four measures of women's emancipation: economic participation
and opportunity, educational attainment, political
empowerment, and health and survival. It
ranges in value between 0 and 1. A value
of 1 corresponds to complete gender neutrality; zero
to macho heaven. According
to the GGI, Northern European countries are the most gender
neutral. Latin American and Muslim countries dominate the bottom
end of the scale. Both in 2006 and 2007 Sweden lead all
nations with GGI scores of 0.8133 and 0.8146,
respectively. Norway, Finland and Iceland followed closely
behind. Yemen, with scores of 0.4510 and 0.4595, bottomed
out the list.
Utilizing data
from PISA 2003, Guiso et al. ran linear regressions
using gender neutrality measures like the GGI as
independent variable. Girl-to-boy ratios in the 95th and 99th percentiles,
as well as gender gaps in the mean were the dependent variables.
Correlations
between sex differences in performance and gender
neutrality emerged, from which the authors concluded that gender-neutral
environments result in gender-equal math performance.
The
theory of Everyone
I will
now
introduce the theory of Everyone, from which will
emerge a somewhat different picture of the
influence of women's emancipation on mathematics
performance. The theory recognizes both cultural
and genetic influences on performance, and enables
their decoupling.
The
postulates:
1. Innate mathematical ability is distributed differently in men and women.
2. Native
ability distributions (not test-score
distributions) of both men and women are the product
of many alleles, and therefore are well approximated by Gaussians (central limit theorem).
3. The
variance ratio and mean difference between male and
female ability distributions are biological constants,
characteristic of the sexes and independent of race,
geography and national culture.
4.
The influence of gender neutrality on test performance
may be treated as a perturbation.
The consequences of
the theory of Everyone are readily revealed in diversity space, a construct
first introduced in Intelligence,
Gender and Race. Let's do a quick review.
Points in diversity space specify the proportions of
each of two groups that attain various thresholds of
achievement. The thresholds, themselves, are not
specified, only the proportions of each group that
reach them. Underlying attainment is ability, which in
general will be distributed differently between- the two groups.
Figure 1 shows
a diversity space of boys and girls.
The point illustrated corresponds to a threshold reached by
60% of girls and 40% of boys. It might, for example,
represent the proportions of girls and boys that pass a
reading comprehension test. The passing grade would then
be the threshold. In the illustration, girls
have more of whatever it takes to reach the threshold.
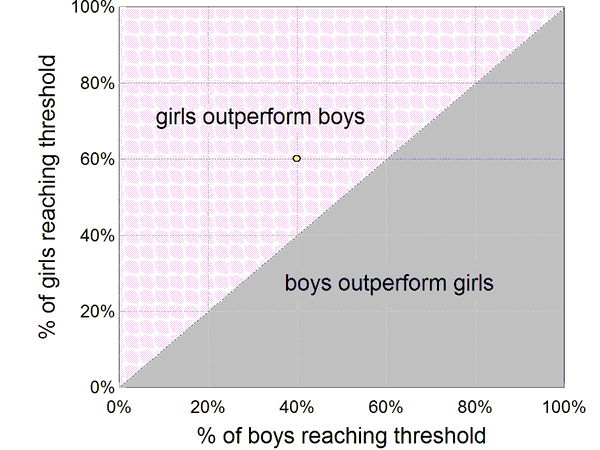
Figure 1. Diversity
space of girls
and boys. The point shown represents a threshold reached by
40% of boys and 60% of girls.
The utility of diversity space
lies in the fact
that not all points are allowed. Those that are, are determined by underlying ability
distributions. If we know the distributions, we can
generate the loci of points, but more often we observe
the points and from them deduce the ability
distributions.
Consider now the diversity space of girls and boys populated with points
obtained from PISA test scores. In previous applications of diversity space, I
employed multiple thresholds. Here, I use PISA math level
5 as the single threshold. (PISA defines six
levels of proficiency, one to six, six being the
highest. Level 5 corresponds
to approximately the 85th percentile.) To populate diversity space, divide boys and
girls into subgroups corresponding to the boys and girls
from each participating country. In this partition, each
country
contributes one point to diversity
space for each year it takes part in PISA testing.
The
theory of Everyone asserts that
mathematical ability in both men and women are Gaussian
distributed. Figure 2 displays in diversity space several curves
from the
family of curves that can be generated from Gaussian
distributions. The curves in the figure were generated
using arbitrary choices of
the distribution parameters. Of the infinity of such
curves, one will best fit the data. Our job is to find
that curve and the ability distributions that generate it.
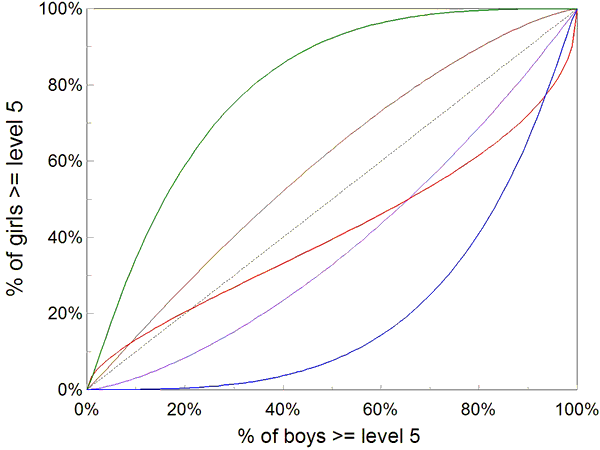
Figure 2.
Several of the infinity of
curves representing possible loci of points in diversity
space. The curves were generated using arbitrary values
for the variance ratio and mean difference in the ability distributions
of boys and girls.
In both PISA 2003 and PISA 2006, the
percentage of students that reached level 5 or higher varied
wildly from country to country. For example, in 2006,
approximately 0.04% of Kyrgyzstani girls and 0.08% of
Kyrgyzstani boys reached level 5 or higher, while that same
year 30% of Korean boys and 24% of Korean girls
achieved at this level. Between these
extremes lay many countries, resulting in a good
spread of points in diversity space.
A 1/N
weighted least squares fit in diversity space of PISA 2003 and 2006
data revealed the underlying
ability distributions. Table 1 shows the resulting
distribution parameters. Included for comparison are
parameters from Project
Talent, a 1960 survey of 73,425 15 year-olds representative of
the entire population
of 15 year-olds in the U.S. -- students and nonstudents alike. After almost half a century
Project Talent remains one of the best assessments
of cognitive sex differences ever made.
| Data Source |
Variance Ratio
(boys/girls) |
Mean Difference
(in standard units)7 |
| PISA 2003 |
1.20 |
0.12 |
| PISA 2006 |
1.13 |
0.15 |
| PISA 2003 and PISA 2006 (combined) |
1.16 |
0.14 |
| Project Talent (1960) |
1.20 |
0.12 |
|
|
Table 1. Math-ability
distribution parameters obtained from PISA and
Project Talent. |
Allowing
for statistical fluctuation, it is evident from Table 1 that:
MATH-ABILITY DISTRIBUTIONS OF
MEN AND WOMEN HAVE NOT CHANGED SIGNIFICANTLY IN AT LEAST HALF A CENTURY.
Figure 3
illustrates the
fit in diversity space of theory to PISA data. In the three years between PISA 2003 and PISA 2006,
Iceland, Korea, Macao-China and the Netherlands, outliers in 2003,
migrated sharply back into the mainstream of performance toward
the theory of Everyone prediction. The Czech Republic moved
in the other direction away from prediction. None
of the swings was
accompanied by a corresponding change in gender
neutrality. They are statistical fluctuations whose size
warns against overinterpreting data from a single
PISA year.
Figure 3. Wild swings in diversity space were
observed between 2003 and 2006. The Netherlands,
Iceland, Korea and Macao-China, outliers in 2003, moved
sharply toward the predicted locus of points, while the Czech Republic moved
oppositely away from prediction.
One gap or many?
The theory of Everyone asserts that there is a single math gender
gap between the distribution means, biological in origin and
independent of race, culture and geography. PISA
math results, however, reveal gaps of many different sizes. So what
are we to believe? Are
there multiple sex gaps, mutable by environmental
factors, or is there a single biological gap? Two tests
will reveal the answer.
1.
Consider countries that participated in both PISA 2003 and
PISA 2006. In the three years separating the tests no
significant changes in cultural attitudes toward women
took place in any nation. Consequently, if gender neutrality
considerations determined gap sizes, we would expect to find no significant
differences between each country's 2003 gap and 2006 gap.
A plot of 2006 gaps against 2003 gaps
would then, allowing for statistical fluctuations, be a straight line
of unit slope. The scatter diagram shown in Figure
4 is such a plot. Each country that took part in both
PISA years, 2003 and 2006, contributed a single point to
the plot giving its gender math gap in both years. Not only do
the points not lie on a straight line of unit slope, but excluding the
outlier Iceland8, there is no
relation whatsoever between the gaps
observed in 2003 and 2006 (r = 0.0006). The
graph is nothing more than a plot of statistical noise.
2.
The second test builds on the first. If differences in observed test-score gaps
from one year to the next are statistical
fluctuations, they should more-or-less cancel leaving
only the biological gap when
calculating the average gap over the two years.
Converting to standard units and taking the average of
the gaps, a mean of 0.11 SD obtains, close to the gaps
from Project Talent and the theory of Everyone (Table
1).
Both
tests confirm a single math-ability gender gap independent
of country, and by implication of
race and culture.
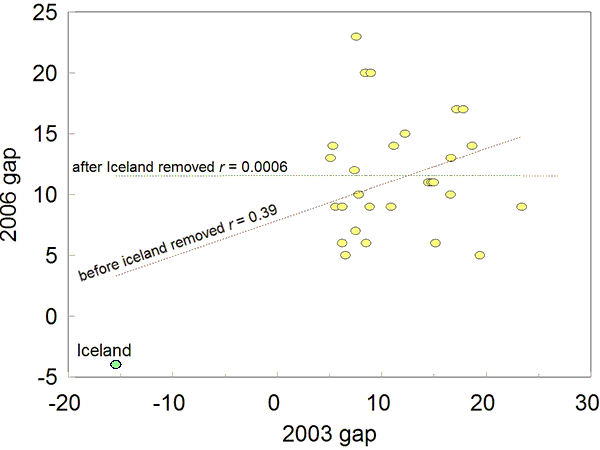
Figure
4. A scatter plot of 2006 gaps vs. 2003 gaps. Each
point represents the gaps obtained by a single country
in successive PISA years. Except for the anomalous Iceland, there is no
relation, whatsoever, between gaps observed
in different years (r = 0.0006).
Parenthetically, there is a lesson here:
Important
conclusions should not be based on the value of a correlation coefficient without first examining the underlying scatterplot.
IQ and gender differences in math ability
National IQ has been
linked to the economic fate of nations.9,
10, 11
But the influence of IQ is more ubiquitous. There is a relationship between
a country's average IQ and the difference in mathematical
ability between its men and women.
Theorem:
THE
GIRL-TO-BOY RATIO AT ALL LEVELS OF ACHIEVEMENT IN
MATHEMATICS INCREASES MONOTONICALLY WITH THE GENERAL INTELLIGENCE OF A
POPULATION.
That
is, in smart countries, girls will perform more like boys
than they will in dumb countries. Figure
5 illustrates the male and female math-ability
distributions. The minimum ability,
λ0, required to
reach a particular but unspecified threshold of
performance is marked on the ability axis.
The ratio of girls to boys,
R, at and beyond the threshold is given by: 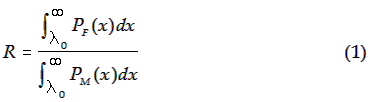
where
PF and PM are
the female and male ability distributions,
respectively, assumed Gaussian in the theory of Everyone.
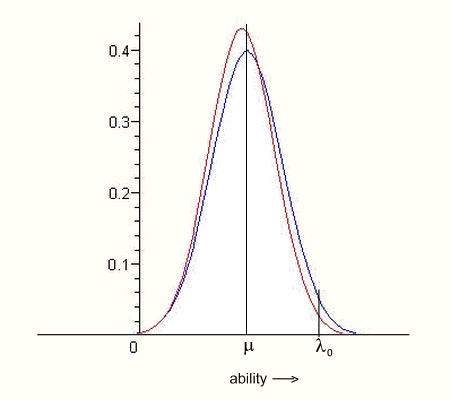
Figure
5. Math-ability distributions of men and women. The
quantity, λ0, is the ability required to reach some specific
threshold of achievement. The quantity, μ, is the
mean male ability. The origin
has been placed arbitrarily.
To evaluate
the girl-to-boy ratio, R, for a country, it is
convenient to choose the
origin as the mean male ability, marked as μ
in Figure 5. Accordingly,
we replace λ0 by λ0
- μ in (1), and after some arithmetic obtain:
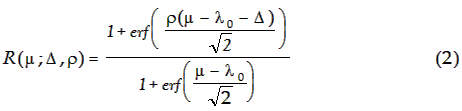
In
(2), Δ is the
mean ability gap (male - female); ρ is the
variance ratio (male/female); and both μ and Δ
are in units of the standard deviation of the male
distribution.
The
expression (2) tell us how the girl-to boy ratio, R,
varies with mean male mathematical ability,
μ. It is plotted in Figure 6.
Arising from the theory of Everyone, (2) is quite
general. It applies at
all levels of proficiency. The ratio, R, as given
by (2) is non-negative for
all values of μ and increases monotonically with μ.
One
story told by (2) and illustrated in Figure 6 is that
girl-to-boy
ratios at all levels of achievement are greatest in
countries with high mathematical ability -- more
precisely, high male ability. But the distinction
is without a difference. National mathematical
ability and national ability of men correlate at r = 1.00.
Both are excellent
proxies for national intelligence as well. PISA
means
correlate at r
= 0.85 with the Lynn and Vanhanen compilation9
of national IQ; PISA means of males correlate at r =
0.87. One could even argue that PISA means,
whether national or male, better assess national intelligence than do the IQs derived by Lynn and Vanhanen
from
often sketchy data and dubious assumptions based on the
Flynn effect. (Alternatively, one could take these
correlations as evidence in support of the L and V
compilation.) 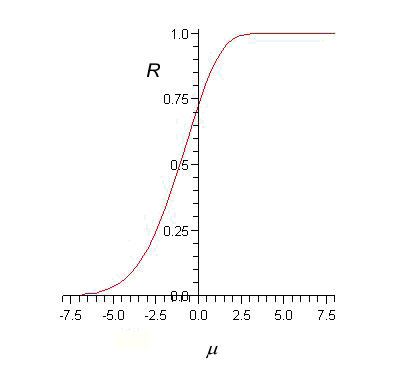
Figure
6. The theory of Everyone predicts how the girl-to-boy
ratio, R,
varies with male mean ability, μ,
a proxy for national IQ.
Figure 7 compares predicted with observed girl-to-boy ratios in PISA levels 5.
Though the ratio increases with national
intelligence (or the proxy PISA mean score), it would take a nation of
cognitive giants to maintain a girl-to-boy ratio near
unity. Mean
scores of the current highest-performing nations would have to increase by almost two standard
deviations.
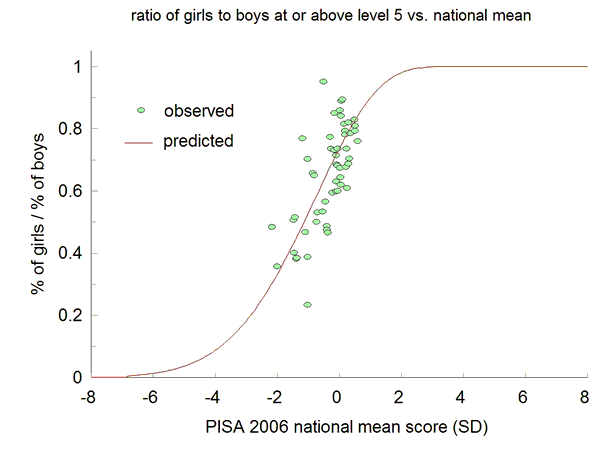
Figure
7. PISA data viewed against the theory of Everyone
prediction.
The link
between culture and female performance
The 12 lowest-performing nations on PISA 2003 and 2006 math tests were: Kyrgyzstan, Colombia,
Tunisia, Argentina, Mexico, Brazil, Thailand, Romania,
Chile, Bulgaria, Uruguay, and Turkey. Nine of these
twelve are either predominantly Muslim or Latin American
countries -- male dominated and not noted for cognitive
facility. The mean national IQ of the
group is estimated at 90.1 (Lynn and Vanhanen9,
2006.)
At the
other end of the PISA math spectrum, the 12 highest-scoring
polities were:
Germany,
Austria, Australia, Czech Republic, New Zealand,
Switzerland, Canada, Netherlands, Japan, Finland,
Belgium and South Korea with a mean national IQ of 100.6.
All are high-IQ Western-style democracies, most with
progressive outlooks on women's emancipation.
Table 2 lists
the average national
IQ
and GGI of the bottom and top performing PISA
countries. Between the highest and lowest performing countries
is an IQ gap of 0.7 standard deviations. There is also a
GGI gap of 1.2 SD in the same direction. Thus, the lowest-performing countries,
dominated by Muslim and Latin cultures, are not only
cognitively limited, but from a feminist perspective
culturally needy.
|
Bottom 12
scoring countries
|
IQ* |
GGI
|
| Kyrgyzstan |
90 |
0.6742 |
| Colombia |
84 |
0.7049 |
| Tunisia |
83 |
0.6288 |
| Argentina |
93 |
0.6829 |
| Mexico |
90 |
0.6462 |
| Brazil |
87 |
0.6543 |
| Thailand |
91 |
0.6831 |
| Romania |
94 |
0.6797 |
| Chile |
90 |
0.6455 |
| Bulgaria |
93 |
0.6870 |
| Uruguay |
96 |
0.6549 |
| Turkey |
90 |
0.5850 |
|
average |
90.1 |
0.6605 |
|
|
|
|
Top 12
scoring countries
|
IQ* |
GGI
|
| Germany |
99 |
0.7524 |
| Austria |
100 |
0.7163 |
| Australia |
98 |
0.8133 |
| Czech Republic |
98 |
0.6712 |
| New Zealand |
99 |
0.7509 |
| Switzerland |
101 |
0.6997 |
| Canada |
99 |
0.7165 |
| Netherlands |
100 |
0.7250 |
| Japan |
105 |
0.6447 |
| Finland |
99 |
0.7958 |
| Belgium |
99 |
0.7078 |
| Korea |
106 |
0.6157 |
|
average |
100.6 |
0.7174 |
*
Estimates from IQ and Global Inequality,
Richard Lynn and Tatu Vanhanen (2006), Washington
Summit Publishers
|
|
| Table 2. IQs and
GGIs for top and bottom PISA scoring countries. |
The theory of Everyone
tells us
that the math abilities of men and women approach each other
as
national IQ increases. Coincidentally, enlightened, high-IQ Western-style democracies
also provide the most favorable environment for women's
emancipation. Ergo a link between cultural barometers
like the GGI and sex differences in mathematics
performance. The link, however, is entirely
accidental. Not to say that culture plays no
part in women's performance. There is a role that
culture plays, and the theory of
Everyone can assess its contribution.
Separating
nature from nurture
Split the fraction
of women, F, that reaches some specific threshold
of performance into an ability contribution, F0(Δ,
ρ), that we have previously described, and
perturbative terms arising from cultural effects in the form of an expansion about
(1-GGI)
F
= F0(Δ, ρ) + α (1-GGI)
+ β (1-GGI)2
+ γ (1-GGI)3 + O([1-GGI]4)
(3)
In (3), Δ
and ρ are the mean difference and variance ratio,
respectively, of the ability distributions of men and
women. With the threshold set at PISA level 5, a least squares fit of (3) in diversity
space produced the distribution parameters listed in Table 3.
Included for comparison are the results of
the original 2-parameter fit ignoring cultural
contributions.
|
mean
difference (Δ)
(boys - girls)
|
variance
ratio
(ρ) (boys/girls) |
|
| PISA
2003 |
5-parameter fit
|
0.15 SD |
1.28 |
2-parameter
fit (without GGI)
|
0.12 SD |
1.20 |
|
| PISA
2006 |
5-parameter fit
|
0.16 SD |
1.13 |
2-parameter
fit (without GGI)
|
0.14 SD |
1.13 |
|
|
Table 3. Least squares values of the
ability-distribution parameters before and after
including perturbative terms. |
The inclusion of perturbative terms increases the gap
between the boy and girl distribution means by 0.02 to 0.03
SD; the
variance ratio remains essentially unchanged. The
previously estimated numerical ceilings on women in the math-intensive marketplace remain intact.
If anything, they are a bit lower.
Figure
8 graphically represents the relative contributions,
determined by (3), of nature, F0(Δ, ρ),
and nurture (the perturbative terms) to the percentage
of girls reaching PISA math level 5. Data from all
countries that took part in either PISA 2003 or PISA 2006
are included in the figure. Female emancipation not withstanding,
there is a formidable biological barrier to overcome before
the math gender gap can be closed. 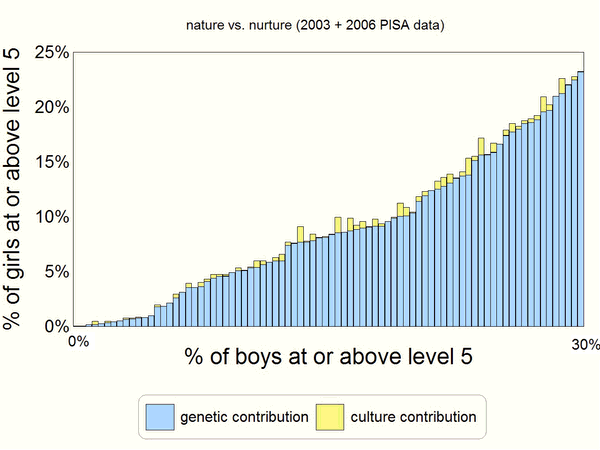
Figure
8. Relative contributions of nature and nurture to
the percentage of girls reaching PISA math level 5 or above.
Data from all nations participating in PISA 2003 and
2006 are included.
In brief, we have seen tonight that the gender gap in
mathematics has been stable for at least half a century;
that sex differences in ability-distribution means and variance ratio are independent of race, culture and
geography; that female math performance is closest to
that of males in high-IQ countries; that
culture plays a role in math performance, albeit small; and
that the theory of
Everyone
accounts for all of the above. If these results
are unsettling, take comfort knowing
that no presentation of
fact, regardless how compelling, will keep the gap buster from her noble calling. Thank
you for listening to a few of the facts.
###
Appendix:
notes and references
[1] L. Guiso, F. Monte, P. Sapienza, L.
Zingales, "Culture, Gender, and Math" Science
320, 1164 (2008)
[2]
JS. Hyde, S. M. Lindberg, M. C. Linn, A. B.
Ellis, C. C. Williams, "Gender similarities
characterize math performance" Science
321, 494 (2008)
[3] J. S. Hyde, E. Fennema, S. Lamon, "Gender
differences in mathematics performance: A
meta-analysis"
Psychol. Bull. 107, 139
(1990).
[4] Among social scientists the term "effect
size" can mean different things. As used by Hyde et
al. and many others, it is the difference between two
group means (in laboratory units)
divided by the population weighted root mean square
standard deviation of the two distributions.
[5] Let NW and NM
be the numbers of women and men, respectively, that
compete for NS tenured-faculty slots
to be filled in rank order of ability. The quantities PW
and PM are the ability distributions
of women and men respectively, and a is the ability of
the dimmest bulb to obtain tenure. Then the following
relation must be satisfied

The two terms on the LHS of (1) represent the numbers
of women and men, respectively, who succeed in gaining
tenure. Numerical solution of (1) gives us a value for a
from which we can evaluate each term individually.
[6] C. P. Benbow, D Lubinski, D. L. Shea, and H.
Eftekhari-Sanjani "Sex Differences in Mathematical
Reasoning Ability at Age 13: Their Status 20 Years
Later" Psychological Science 11,
No. 6, 2000.
[7] The difference between the male and female
distribution means obtained by the least squares fit in
diversity space are in standard deviation units of the male
distribution. In order to compare our results with
others, they were converted to "effect size" as
defined above in Note 4. Here's how we did it.
Bars denote laboratory units throughout. The effect
size, d, as defined above is:
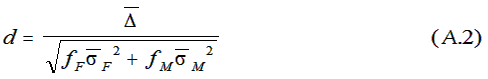
where Δ
is the (male-female) mean difference, σF
and σM
are the standard deviations of the female and male
distributions, respectively; fF and fM
are the female and male fractions of the sample
population, respectively.
Let
δ be the difference
(male - female) between the distribution mean in units
of the male-distribution standard deviation. (This is
the quantity obtained from the least squares fit in
diversity space.) Then we may write:

From (1) and (2) we obtain the desired relation
between the effect size and d,
i.e.,
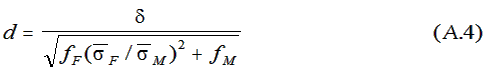
The ratio of standard deviations,
σ
F/σM,
is dimensionless. Values of the ratio
and
δ are obtained from the least squares fit.
In the special case where men and women are equally
represented in the sample, (3) simplifies to
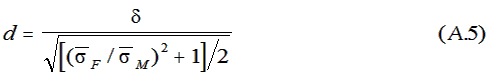
We used (5) to make the conversion to effect size.
The difference between d and
δ was less than 5% in all cases.
[8]
Icelandic girls performed anomalously well in both PISA
2003 and 2006. A more detailed look at Icelandic data,
however, reveals that only in rural Iceland were girls'
mean scores higher than boys'. In the Reykjavik
metropolitan area the math performance of girls and boys
was much like that found in other countries. No
satisfactory explanation of the Icelandic anomaly has
yet been put forth.
[9] IQ and Global Inequality, R. Lynn and T.
Vanhanen, Washington Summit Publishers, 2006.
[10] The
Smart Fraction Theory of IQ and the Wealth of Nations,
La Griffe du Lion, Vol. 4 No. 1 2004.
[11] Smart
Fraction Theory II: La Griffe du
Lion, Vol. 6 No. 2, 2004
|